Recommended Ressource
eBPF (extended Berkeley Packet Filter) is a technology that allows running sandboxed programs in the Linux kernel.
Here is a list of resources you can read to understand this concept:
- [Tool EN] EBPF Official Website
- [Video FR] EPBF details
- [Post FR] EBPF details
EBPF
Original lesson from https://www.kentik.com/blog/ebpf-explained-why-its-important-for-observability/
Summary
eBPF is a powerful technical framework to see every interaction between an application and the Linux kernel it relies on. eBPF allows us to get granular visibility into network activity, resource utilization, file access, and much more. It has become a primary method for observability of our applications on premises and in the cloud. In this post, we’ll explore in-depth how eBPF works, its use cases, and how we can use it today specifically for container monitoring.
eBPF is a lightweight runtime environment that gives you the ability to run programs inside the kernel of an operating system, usually a recent version of Linux. That’s the short definition. The longer definition will take some time to unpack. In this post, we’ll look at what eBPF is, how it works, and why it’s become such a common technology in observability.
What is eBPF?
BPF, which stands for Extended Berkeley Packet Filter, is a lightweight virtual machine that can run sandboxed programs in a Linux kernel without modifying the kernel source code or installing any additional modules.
eBPF operates with hooks into the kernel so that whenever one of the hooks triggers, the eBPF program will run. Since the kernel is basically the software layer between the applications you’re running and the underlying hardware, eBPF operates just about as close as you can get to the line-rate activity of a host.
An application runs in what’s called user space, an unprivileged layer of the technology stack that requires the application to request resources via the system call interface to the underlying hardware. Those calls could be for kernel services, network services, accessing the file system, and so on.
When an application runs from the user space, it interacts with the kernel many, many times. eBPF is able to see everything happening at the kernel level, including those requests from the user space, or in other words, by applications. Therefore, by looking at the interactions between the application and the kernel, we can learn almost everything we want to know about application performance, including local network activity.
Note that eBPF can also be used to monitor user space via uprobes, but we focus primarily on kernel activity for network observability.
How does eBPF work?
Bytecode
The BPF virtual machine runs a custom bytecode designed for verifiability, which is to say that you can write directly in bytecode, though writing directly in bytecode is onerous at best. Typically, eBPF programs are written to bytecode using some other language. For example, developers often write programs in C or Rust compiled with clang, which is part of the LLVM toolchain, into usable bytecode.
Bytecode is generated by a compiler, but the actual programs are compiled just-in-time (JIT). This also allows the kernel to validate the code within boundaries before running it. The JIT step is optional and should occur after validation.
eBPF bytecode is a low-level instruction set written as a series of 64-bit instructions executed by the kernel. The eBPF bytecode instructions are expressed as hexadecimal numbers, each consisting of an opcode and zero or more operands.
Here’s an example of what eBPF bytecode might look like:
0x85, 0x00, 0x00, 0x00, 0x02   ; load 2 into register 0
0x18, 0x00, 0x00, 0x00, 0x00   ; load 0 into register 1
0x07, 0x00, 0x00, 0x00, 0x00   ; add registers 0 and 1, store result in register 0
0xbf, 0x00, 0x01, 0x00, 0x00   ; exit syscall with return value from register 0
this example code loads the value 2 into register 0, loads 0 into register 1, adds the values in registers 0 and 1, and then exits the program with the result in register 0. This is a simple example, but eBPF bytecode can perform much more complex operations.
Using Python to write eBPF applications
Additionally, developers often use a python front end to write an eBPF application in user space. This makes writing eBPF programs much easier because of how commonly used python is, but also because of the many existing libraries for developers to take advantage of. However, it’s important to note that these Python programs are very specific to the BCC toolchain, not a general way of writing BPF apps.
To program eBPF with Python, you can use the bpf module in the bpfcc library. This library provides a Python interface to the BPF Compiler Collection (BCC), which allows you to write and load eBPF programs from Python.
For example, to write an eBPF program in Python to monitor tcpretransmits, you can use the BPF class from the bpfcc library to define a kprobe that attaches to the tcp_retransmit_skb function and captures information about retransmissions.
Here’s an example of what the Python code might look like:
from bcc import BPF

# define the eBPF program
prog = """
#include <uapi/linux/ptrace.h>

BPF_HASH(start, u32);
BPF_PERF_OUTPUT(events);

int kprobe__tcp_retransmit_skb(struct pt_regs *ctx, struct sock *sk, struct sk_buff *skb) {
    u32 pid = bpf_get_current_pid_tgid();

    // track the starting time of the retransmit attempt
    u64 ts = bpf_ktime_get_ns();
    start.update(&pid, &ts);

    return 0;
}

int kretprobe__tcp_retransmit_skb(struct pt_regs *ctx) {
    u32 pid = bpf_get_current_pid_tgid();
    u64 *tsp = start.lookup(&pid);

    // calculate the duration of the retransmit attempt
    if (tsp != NULL) {
        u64 now = bpf_ktime_get_ns();
        u64 delta = now - *tsp;
        events.perf_submit(ctx, &delta, sizeof(delta));
        start.delete(&pid);
    }

    return 0;
}
"""

# create and load the eBPF program
bpf = BPF(text=prog)

# attach the eBPF program to the tcp_retransmit_skb function
bpf.attach_kprobe(event="tcp_retransmit_skb", fn_name="kprobe__tcp_retransmit_skb")
bpf.attach_kretprobe(event="tcp_retransmit_skb", fn_name="kretprobe__tcp_retransmit_skb")

# define a function to handle the perf output events
def print_event(cpu, data, size):
    # unpack the duration of the retransmit attempt
    event = bpf["events"].event(data)
    duration = float(event) / 1000000

    print("TCP retransmit detected (duration: %0.2f ms)" % duration)

# loop and handle perf output events
bpf["events"].open_perf_buffer(print_event)
while True:
    bpf.kprobe_poll()
In this example, we define an eBPF program that creates a hash map to track the starting time of retransmit attempts and a PERF_OUTPUT event that captures the duration of the retransmit attempt. We then attach the eBPF program to the tcp_retransmit_skb function using both a kprobe and a kretprobe, which allows us to capture both the start and end of the function call.
We define a function to handle the PERF_OUTPUT events, which unpacks the duration of the retransmit attempt and prints it to the console. Finally, we loop and handle the perf output events using the open_perf_buffer and kprobe_poll methods.
This eBPF program will track tcpretransmits and print out the duration of each retransmit attempt. You can modify the program to capture other information as well, such as the number of retransmit attempts or the source and destination IP addresses of the affected packets.
This method can help us understand the cause of an application performance problem. In general, this is a sign that some packet loss is occurring on the network. This could be due to congestion or even errors on the remote NIC. Usually, when this happens, the network connection seems slow, but things are still working.
Higher level abstractions
or another level of abstraction, open source tools have emerged, such as Cilium, which runs as an agent in container pods or on servers. Often tied with common tools like Grafana and Prometheus, Cilium is a management overlay used to manage container networking using eBPF. However, Cillium is also much more than this. It’s a data plane that leverages eBPF to implement service meshes, observability, and networking functions as well.
Now owned by New Relic, Pixie is another popular open source eBPF management overlay with an attractive graphical user interface. Since these management tools operate at the kernel level via eBPF, they can also be used for observability, especially with containers.
eBPF Programs: Interacting between user space and kernel
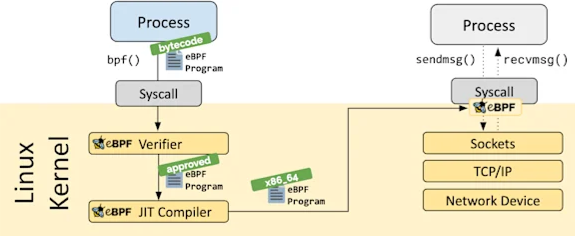
Regardless of how you write them, the eBPF programs themselves are loaded from user space into the kernel and attached to a kernel event. This is when we start to see the benefits of eBPF because when the event we attached our program to occurs, our program runs automatically. So after being loaded from user space, an eBPF program will live in the kernel.
Before the program is loaded into the kernel, it’s run through a built-in verification function called a verifier that ensures the eBPF program is safe from both operational and security perspectives. This is important because it’s in this way that we know that our eBPF programs won’t use resources they shouldn’t or create a type of loop scenario. However, it’s important to note that the verifier doesn’t perform any sort of policy checks on what can be intercepted.
After the eBPF program passes the verifier, it’s just-in-time compiled into native instructions and attached to the hooks you want to use for your custom program. On the left side of the graphic below, you can see the eBPF program go from user pace (Process) through the verifier, the JIT compiler, and then on the right, attached to the relevant hook(s).
Hooks can be almost anything running in the kernel, so on the one hand, eBPF programs can be highly customized, but on the other hand, there are also inherent limitations due to the verifier limiting access to the program.
eBPF Maps
Once run, the eBPF program may have gathered information that needs to be sent back to user space for some other application to access. This could be to retrieve configuration to run when a hook is triggered or to store gathered telemetry for another program to retrieve. For this, we can use eBPF maps. eBPF maps are basically generic data structures with key/value pairs and read/write access by the eBPF program, other eBPF programs, and user space code such as another application.
Like eBPF programs, eBPF maps live in the kernel, and they are created and accessed from user space using the BPF syscall and accessed by the kernel via BPF helper functions. There are several types of maps, such as an array, hash, prog array, stack trace, and others, with hash maps and arrays being the most commonly used.
Though eBPF maps are a common method for coordinating with user space, Linux perf events would also likely be used for large volumes of data like telemetry.
Lightweight performance monitoring with eBPF
In the context of eBPF, “lightweight” means several things. First, eBPF is fast and performant. The eBPF program uses very minimal resources. eBPF uses a just-in-time (JIT) compiler, so once the bytecode is compiled, it isn’t necessary to re-interpret the code every time a program is run. Instead, the eBPF program runs as native instructions, which is a faster and more efficient method for running the underlying bytecode.
Second, an eBPF program doesn’t rely on probes or a visibility touchpoint in the network or application, so no traffic is added to the network. This may not be an issue in a very small, low-performance network; however, in a large network that requires many probes and touchpoints to monitor effectively, adding traffic can adversely affect the performance of the network in terms of latency, thereby skewing the monitoring results and possibly impacting application performance.
There is an important distinction between monitoring traffic originating from or terminating at the system running the BPF program, as opposed to network traffic in general.
Of course, using probes and artificially generated traffic isn’t inherently bad. That sort of monitoring is very useful and plays a significant role in active monitoring. Still, in some scenarios, passive monitoring is required to get the granular, real-time performance statistics of production traffic as opposed to the artificial traffic among monitoring agents.
Third, because eBPF can glean telemetry directly from the processes running in the kernel, there’s no need to capture every single packet to achieve extremely granular visibility. Imagine a scenario in which you’re running 40Gbps, 100Gbps, or even 400Gbps links, and you need that level of granularity. Capturing every packet at those link rates would be nearly impossible, let alone prohibitively expensive to do. Using eBPF, there’s no need for an additional physical tap network, and there’s no need to store the enormous number of copied packets.
Next, eBPF doesn’t rely on traffic passing through probes or agents, which may need to traverse a variety of network devices both on-premises and in the cloud. For example, to determine latency using traffic generated from probes or by analyzing packets, that traffic would likely pass through routers, firewalls, security appliances, load balancers, etc. Each of those network elements could potentially add latency, especially the security devices doing DPI.
Lastly, prior to eBPF, kernel modules had to be written and inserted into the kernel. This could potentially, often did, have catastrophic results. Before eBPF, if a new module inserted into the kernel faulted, the module would also cause the kernel to crash.
eBPF and application latency
When determining application latency accurately, eBPF is very useful because it draws information directly from the kernel and not from traffic moving around the network. Additionally, those routers, load balancers, and firewalls could potentially route traffic differently packet-by-packet or flow-by-flow, meaning the visibility results may not be accurate.
Deterministic best-path selection is a strength of modern networking, but when it comes to measuring latency, if your probes take a different path each time, it poses a problem in getting an accurate picture of network latency between two targets.
Instead, an eBPF program is designed to observe what’s happening in the kernel and report on it. Network and kernel I/O latency have a direct relationship with application latency, and there are no probes to skew the data or packets to capture and process.
eBPF use cases
There are several use cases for running eBPF at the kernel level. The first is for networking, specifically routing. Using eBPF, we can program kernel-level packet forwarding logic, which is how certain high-performance routers, firewalls, and load balancers operate today. Programming the forwarding logic at the kernel level results in significant performance gains since we are, in effect, routing in hardware at line-rate.
The most commonly used hooks for networking are XDP, or eXpress Data Path, tc, or traffic control, and the variety of hooks used for programming the data plane directly. XDP and tc are often used in conjunction because XDP can capture only ingress traffic information, so tc will also be used to capture information about egress traffic.
Second, eBPF can be used for both packet-level and system-call visibility and filtering, making it a powerful security tool. If an undesirable or potentially malicious system-call is observed, a rule can be applied to block it. If certain packet-level activity is observed, a filter can be applied to modify it. The benefit of this is providing visibility and remediation as close to the target as possible.
A third use case is observability, which we’ll focus on in this post. In the classic sense, observability is determining the state of a system by looking at its outcomes without making any changes to the system itself. Since eBPF doesn’t affect the performance of the kernel, including its processes, we can get extremely accurate information about network and application performance without it being skewed by having to draw resources from the kernel itself.
In this way, you can gather runtime telemetry data from a system that does not otherwise have to expose any visibility points that take up system resources. Furthermore, collecting telemetry this way represents data at the actual source of the event rather than using an exported format of sampled data.
What can you learn with eBPF?

You can learn a tremendous amount of information using eBPF; this graphic represents only a portion of what you can do. eBPF is event-driven, so we collect information about every event in the kernel. We can then learn about everything happening on a host machine or container, including each individual application.
An eBPF program runs when the kernel or the application you’re interested in passes a specified hook or hook point, including network events, system calls, function entry, function exit, etc.
So if we want to know about a single application’s activity and overall performance, we can learn by using specific hooks that grab that telemetry without modifying the application or inadvertently affecting its performance.
In the graphic above, the network stack is the area in light green. Notice again what kind of information you can learn directly from the source using eBPF.
These are all important functions of observability at the network layer, so to expand on just a few:
tcptopallows you to summarize, send, and receive throughput by the host.tcpdropallows you to trace TCP packet drops.tcpconnectallows you to trace active TCP connections.tcpretransmitallows you to see the retransmission of TCP packets when an acknowledgement expires, a common cause of latency.tcpstateallows you to see the TCP state changes and the duration in each part of the process.
With the information we get from the functions above other eBPF tracing functions, we can ask questions such as:
- Is my slow application experiencing TCP retransmits?
- Is network latency affecting the performance of my interactive application?
- Is traffic from my container(s) going to an embargoed country?
- Is the remote server I don’t own taking longer than expected to process my TCP request?
Conclusion
The nature of modern application delivery requires new methods for observability. Because so many applications are delivered over a network, ensuring application availability and great performance means having deep system visibility and granular network visibility in the context of those applications.
eBPF has emerged as a perfect solution for collecting passive telemetry in modern environments, especially in the context of cloud and cloud-native containers. Operating at the kernel level and being lightweight means eBPF can provide us the telemetry we need specifically about application activity without inadvertently and adversely affecting application performance.
Though eBPF has other uses, such as networking and security, its benefits to modern observability are changing the way we both see and understand what’s happening with the applications making their way over networks around the world.
C05-01: Reversing EBPF
eBPF is a modern tool for developers who want to secure userland calls. It allows tracing, dumping, and modifying data incoming from userland to the kernel, enabling the inspection and verification of a wide range of applications.
In this exercise, let’s delve into a small eBPF program that performs alterations on a read() primitive.
You can find some help for reversing eBPF bytecode here:
https://github.com/Nalen98/eBPF-for-Ghidra (Ghidra) https://github.com/zandi/eBPF_processor (IDA)
The flag format is LRCTF{PrintableAscii}.
flag md5sum: 3c97e2ab1aa6177876ea39bef240dfa5